Do Republicans cause gun deaths?
Indirectly “yes”, but I will ultimately argue “no”.
Introduction
Lots of people in the US are killed by guns. Guns are a leading cause of death among children. Mass shootings happen nearly daily. Gun laws and controls are a hotly debated and divisive political issue in the US. (Citations needed!)
I will use data on gun deaths to illustrate Omitted Variable Bias, and to also explore the link between gun ownership and gun deaths.
Description of the data
The data is for US states in 2016, and comes from various sources.
| Variable | Description | Source |
|---|---|---|
| death.per.100k | The number of gun deaths per 100,000 people, in 2016. | CDC |
| trump.vote | The percentage of votes for Trump in 2016. This variable is meant to measure the percentage of Repbulicans by state. | New York Times |
| gun.owner | The estimated percentage of households in 2016 that owned guns. | RAND |
| back.check | A dummy variable indicating whether the state has background checks. | RAND |
Download the data
Download the data from the website using:
guns <- read.csv("https://rtgodwin.com/data/guns.csv")
Take a look at the first 6 observations for each variable:
head(guns)
       state death.per.100k gun.owner trump.vote back.check permit
1    Alabama           21.5      52.8       62.1          0      0
2     Alaska           23.3      57.2       51.3          0      0
3    Arizona           15.2      36.0       48.1          0      0
4   Arkansas           17.8      51.8       60.6          0      0
5 California            7.9      16.3       31.5          1      1
6   Colorado           14.3      37.9       43.3          1      0
- Notice that Alabama has a lot of deaths (21.5) and Republicans (62.1%).
- California has few deaths (7.9) and Republicans (31.5%).
- Think about the magnitude of these numbers. With a population of 39.15 million in 2016, 7.9 deaths per 100k means 3,093 deaths.
- Look at how many households have guns!
A link between Republicans and gun deaths?
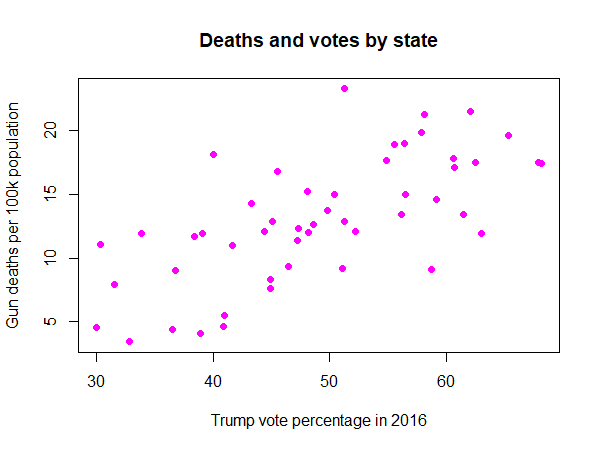
Plot the data:
plot(guns$trump.vote, guns$death.per.100k,
     xlab = "Trump vote percentage in 2016",
     ylab = "Gun deaths per 100k population",
     main = "Deaths and votes by state",
     pch = 16, col = "magenta")

Now we’ll estimate the model:
$death.per.100k = \beta_0 + \beta_1trump.votes + \epsilon$
In R we can use:
mod1 <- lm(death.per.100k ~ trump.vote, data = guns)
summary(mod1)
Coefficients:
            Estimate Std. Error t value Pr(>|t|)
(Intercept) -2.95296    2.57444  -1.147    0.257
trump.vote   0.32572    0.05131   6.348 7.36e-08 ***
---
Signif. codes:  0 ‘***’ 0.001 ‘**’ 0.01 ‘*’ 0.05 ‘.’ 0.1 ‘ ’ 1

Residual standard error: 3.67 on 48 degrees of freedom
Multiple R-squared:  0.4564,	Adjusted R-squared:  0.4451
F-statistic:  40.3 on 1 and 48 DF,  p-value: 7.357e-08
- The estimated effect of 0.32572 means that an additional 1% vote for Trump is associated with an extra 0.33 gun deaths per 100,000 population.
- To try to put this in perspective, in California this would be an extra 129 gun deaths in 2016.
- The p-value on
trump.voteis small (0.0000000736). We reject the null that percentage of Republicans have no association with gun deaths. According to this model,trump.voteis statistically significant. - The $R^2$ is 46%.
The above estimated effect of trump.vote on gun deaths is likely biased. This is a situation of Omitted Variable Bias (OVB). What do you think the most important determinant of gun deaths is?
A model that uses the percentage of households that have guns
We’ll estimate a model that includes more variables (gun.owner and back.check). The new population model is:
$death.per.100k = \beta_0 + \beta_1trump.votes + \beta_2gun.owner + \beta_3back.check + \epsilon$
In R we can use:
mod2 <- lm(death.per.100k ~ trump.vote + gun.owner + back.check, data = guns)
summary(mod2)
Coefficients:
            Estimate Std. Error t value Pr(>|t|)
(Intercept)  1.74293    2.87344   0.607 0.547121
trump.vote   0.08054    0.07435   1.083 0.284361
gun.owner    0.19353    0.05075   3.814 0.000406 ***
back.check  -1.26643    1.23944  -1.022 0.312231
---
Signif. codes:  0 ‘***’ 0.001 ‘**’ 0.01 ‘*’ 0.05 ‘.’ 0.1 ‘ ’ 1

Residual standard error: 3.198 on 46 degrees of freedom
Multiple R-squared:  0.6044,	Adjusted R-squared:  0.5786
F-statistic: 23.42 on 3 and 46 DF,  p-value: 2.37e-09
trump.vote is no longer statistically significant!
- We fail to reject the null that percentage of Replubicans have no effect on gun deaths.
- However, the percentage of gun owners has a statistically significant effect: we reject the null that
gun.ownerhas no effect on deaths. - It is estimated that for every additional 1% of households that own guns, an extra 0.19 people died per 100k.
- Backgorund checks have a negative, but statistically insignificant impact.
Summary
After including gun.ownership, trump.vote is no longer statistically significant. On einterpretation of the above estimated results is that the percentage of Republicans only effects gun deaths through the tendency of Republicans to have more guns. That is, after controlling for the amount of guns, it doesn’t matter whether a people are Republican or not. That is, two state with differing percentages of Republicans, but with the same percentage of guns, would have the same amount of gun deaths.